Unlock insights with the new EasyWP Stats menu


We’re extremely excited to announce that your EasyWP dashboard just got a major upgrade. In response to your feedback, we’ve replaced technical-only analytics with a powerful new Stats menu designed to help you truly understand your website visitors and make smarter decisions about your site’s content and growth.
Visitor-centric analytics for all
EasyWP has always offered some analytics, focused on technical backend data like RAM and CPU usage. While this is helpful, we came to realize that you wanted audience metrics to help with site optimization and boosting engagement.
With the launch of the enhanced Stats menu, you can now access visitor-based data points that provide a window into how people find and interact with your WordPress site. This is perfect for solopreneurs, bloggers, freelancers, and small businesses looking to build an engaged audience and a meaningful online brand.
Actionable insights at a glance
It’s now easier to learn where your users are coming from, when they are most engaged, and all of the top user metrics site owners wonder about most. And all of this data is now available without installing a single plugin.
Here’s everything you can keep track of in the new Stats menu.
Top traffic sources
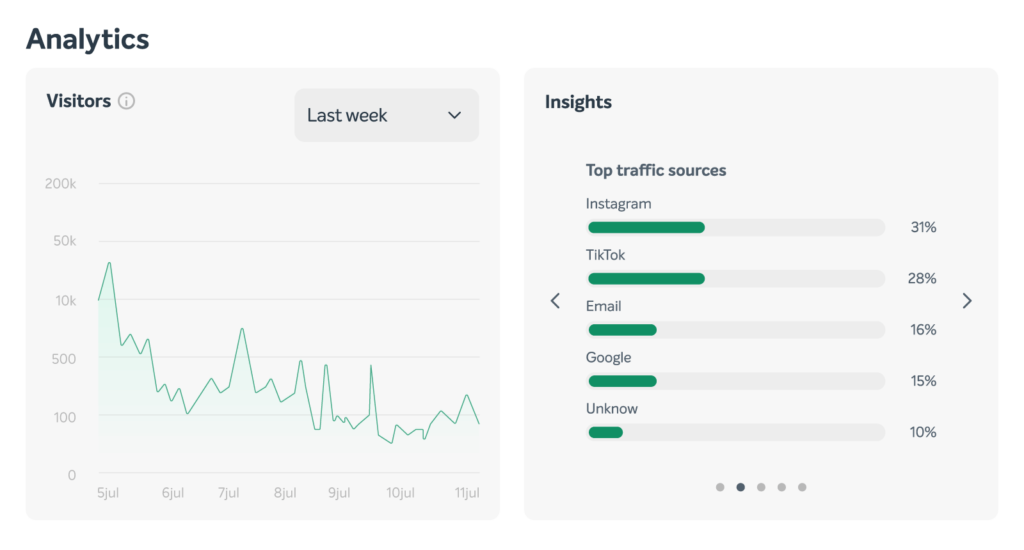
Quickly see where your site visitors are coming from, whether that’s Google, Instagram, TikTok, or other platforms. Knowing your most effective channels lets you focus your marketing and outreach where it drives results. See a list of top sources, as well as follow trends over time.
Visitor devices
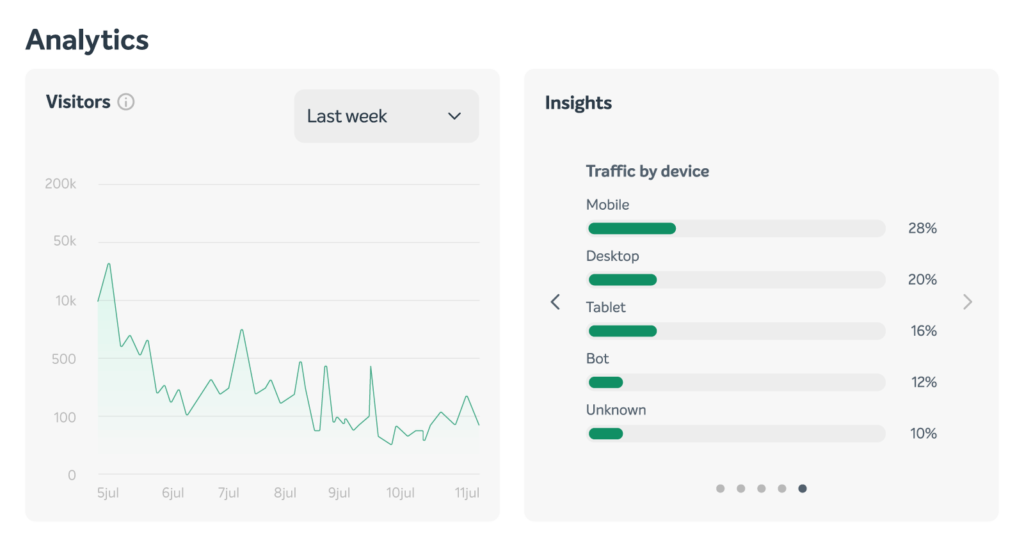
Want to make your site more user-friendly? Find out whether your visitors are primarily using mobile, desktop, or tablet devices, and optimize for the screen dimensions you see most often. Differentiate between real people and bot traffic, and fine-tune your site’s design to put the human experience first.
Bandwidth usage
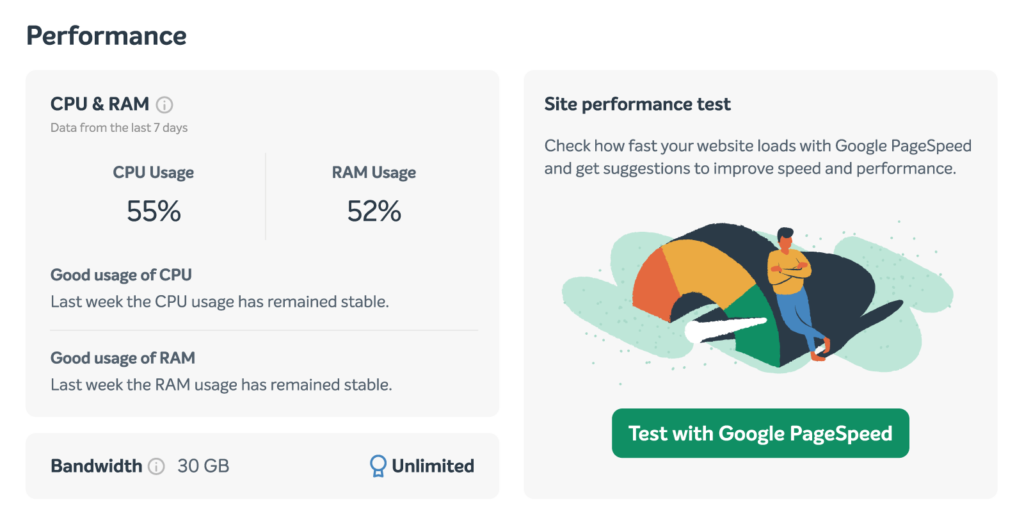
See your site’s bandwidth use over the past 30 days, and validate that your website is performing well. No need to worry — this info is for your reference only, as EasyWP doesn’t limit bandwidth. It’s just a helpful measurement of site activity, and lets you know that the EasyWP infrastructure is handling traffic properly.
Most visited pages
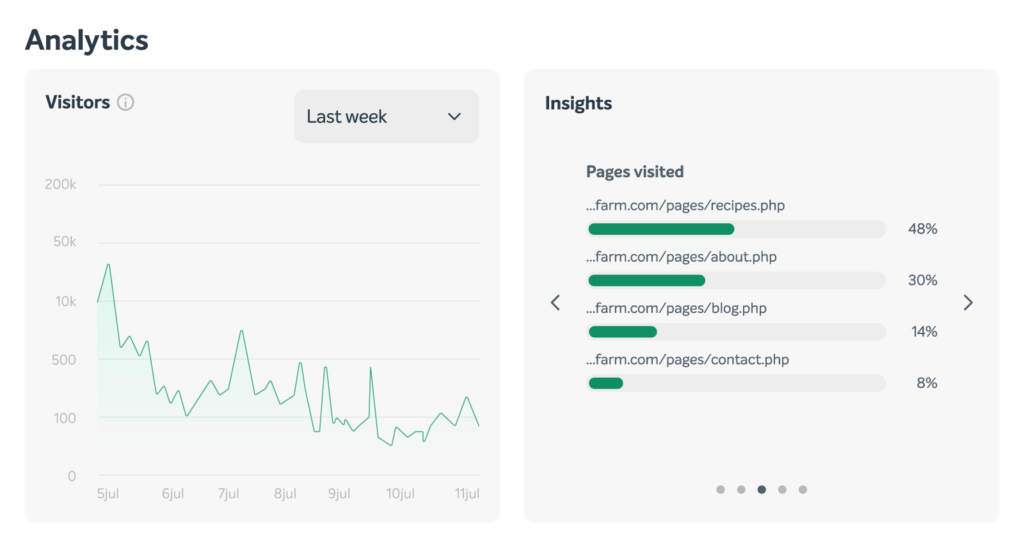
Learn which pages attract the most attention, so you can prioritize updates, calls-to-action, or improvements where they’ll have the biggest impact. These statistics help you plan future content topics that will resonate with users. Compare these insights with your traffic source report to determine what type of page performs well from platform to platform.
Top countries
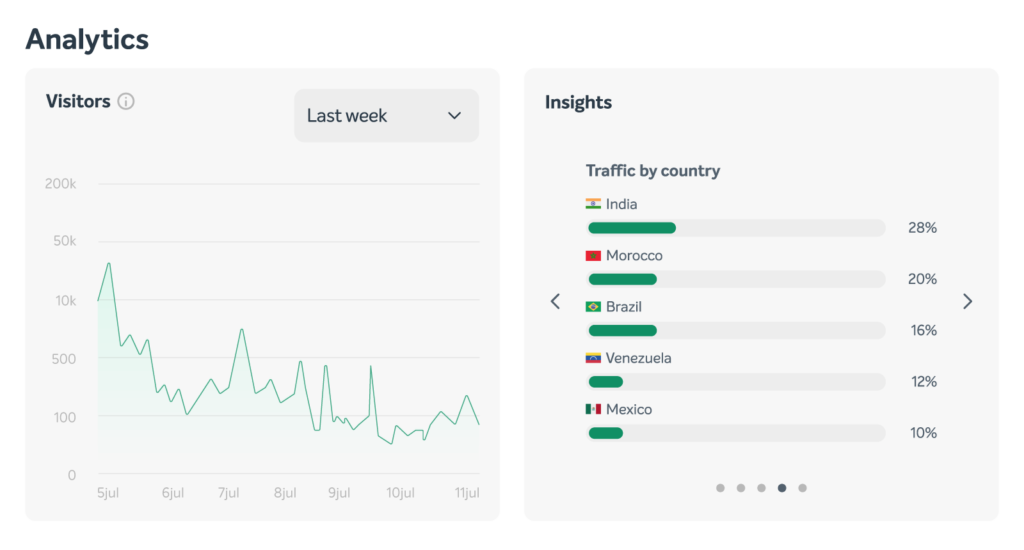
Discover the geographic locations of your site’s audience and tailor your content or offers to different regions as your global reach grows. Compare different time periods, and investigate what events lead to changes in global traffic patterns. You might even discover you have fans in parts of the world you never knew about before.
Adjustable time periods
While all of these statistics are interesting, it’s comparing the changes over time that leads to real insights. Analyze trends and track growth by exploring stats with new date range options for the Visitors graph: 7 days, 30 days, 3 months, or 6 months. This wider view helps you spot long-term patterns and act on them.
Pay special attention to traffic changes from day-to-day, and from month to month, and then spend time investigating the reasons for any unusual spikes or dips in user totals. Knowing these trends can help you celebrate milestones and plan for seasonality in the future.
Effortless access — no extra steps needed
The new Stats feature is already live for all EasyWP users. If you’ve just created a new site, insights will start showing 14 days after you launch. For existing sites, your stats are available immediately in your EasyWP Dashboard — simply visit the Stats menu (replacing the old Analytics menu) to get started. You don’t need to install or configure anything new.
How will this help you?
- Make data-driven decisions – See which channels and pages are working best, and allocate your time and efforts accordingly.
- Boost engagement – Release new content or promotions during your busiest hours for maximum visibility.
- Improve website experience – Design for the devices your visitors actually use.
- Grow your audience – Understand where visitors come from, and develop targeted strategies to reach more people in key locations.
Turn insights into action with EasyWP
Log in to your EasyWP Dashboard and discover your new stats today. These actionable insights will help you optimize your site, better understand your audience, and accelerate your online success.
When you’ve got a strong understanding of these basic stats, check out our guide to Google Search Console, and dig deeper into the advantages of monitoring customer data.
More articles from us!
